
Automated Data Collection using Computer Vision
Background
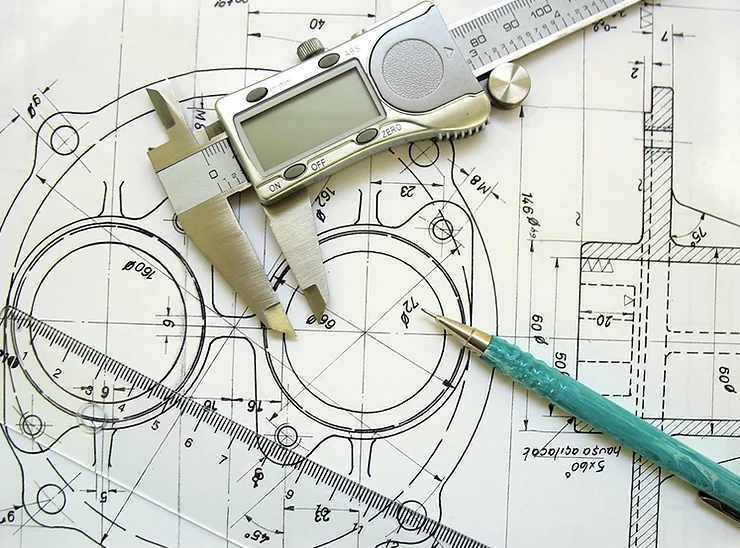
This project focuses on monitoring the carbon dioxide levels in the air while 3D printers are operational in the laboratory. Data acquisition will be achieved from the following sources: sensors, air quality monitors, and a power meter. I was in charge of collecting and analyzing the data from the air quality monitor using computer vision. The results from the three data streams will be fed into a machine-learning model for training purposes.

Figure 1: Lab's set up of the experiment
Technical Details
Project overview


Data Collection
Datasets will be generated to train the machine learning model. One of the data streams will be collected from an Air Quality Monitor in real time during operation.
-
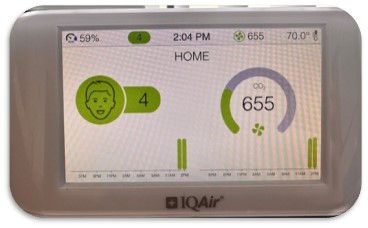
A webcam connected to a laptop to record a video of the air monitor screen, allowing us to observe the changing CO2 levels over time
-
The webcam was positioned in front of the air quality monitor to record CO2 levels during a 3D printing operation.
-
The CO2 levels displayed on the air quality monitor were collected using computer vision.
-
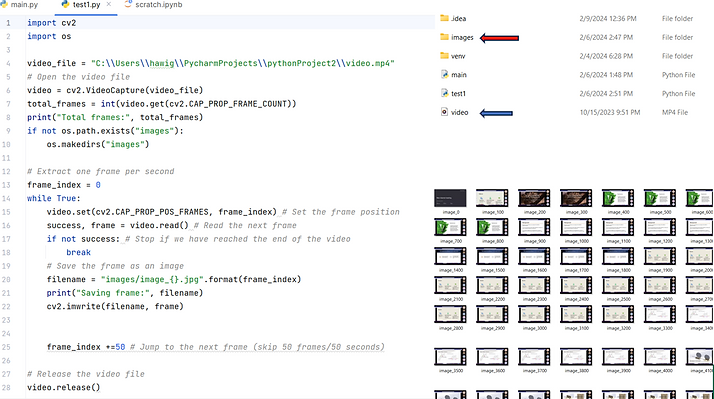
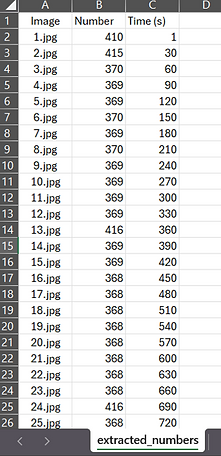
Python code was developed to extract frames from the video, capture the CO2 readings, and automatically save them to an Excel sheet. This file was then used as input data for training a machine-learning model.

Project Results
-
A machine learning framework was developed and validate using Gaussian Process Regression (GPR) to predict CO₂ emission levels during 3D printing operations
-
Real-time air quality monitor data (CO₂, particulates, and other emissions) was integrated with printing parameters and ambient sensor readings to assess environmental impacts.
-
Yokogawa energy consumption measurements was incorporated to quantify power usage, enhancing model accuracy and supporting validation through Life Cycle Assessment (LCA).
-
A strong predictive performance was achieved due to GPR’s ability to capture both linear and non-linear relationships, manage uncertainty/noise, and remain robust under limited data availability.
-
Correlation analysis between print parameters (e.g., print speed, layer thickness, build plate temperature) and environmental conditions (e.g., temperature, humidity, pressure) revealed key drivers of CO₂ fluctuations, supporting model accuracy and offering insights for emission reduction strategies.
-
Strong positive correlations
-
Print speed ↔ Extruder temperature (0.75) → faster printing requires higher extrusion temperature.
-
Build plate temperature ↔ Pressure (0.86) → higher bed temps lead to increased chamber pressure.
-
Temperature ↔ Humidity (0.60) → lab environmental conditions rise together.
-
-
Strong negative correlations
-
Print speed ↔ Layer thickness (-0.79) → faster speeds produce thinner layers.
-
Infill density ↔ Build plate temperature (-0.70) → denser prints reduce bed temperature stability.
-
Extruder temperature ↔ Gas concentration (-0.56) → higher extrusion temps lower gas readings.
-
-
Outcomes/lesson learned
-
Performed Dynamic Life Cycle Assessment (LCA) integrated with Machine Learning to enable a data-driven and holistic approach to environmental evaluation and decision-making.
-
Gained exposure to a new programming language (Python), including neural networks and the OpenCV library.
-
Performed image manipulation and processing.
-
Handled 3D printing tasks.
-
Contributed to the development of a research paper.
-
Collaborated with a professional research team, including two PhDs and a Master’s student.
-
Conducted literature reviews and provided bi-weekly research updates to the supervisor.